Web View (with OpenObserve)
Send Wake logs to OpenObserve and inspect them in a browser. This is useful when you want a shareable view during debugging, incident response, or longer --since investigations.
Quick Setup
1. Start OpenObserve
mkdir -p data
chmod +x data

docker run -d \
  --name openobserve \
  -v $PWD/data:/data \
  -p 5080:5080 \
  -e ZO_ROOT_USER_EMAIL="root@example.com" \
  -e ZO_ROOT_USER_PASSWORD="Complexpass#123" \
  -e ZO_COMPACT_DATA_RETENTION_DAYS=3 \
  -e ZO_ORG_DATA_QUOTA=10737418240 \
  -e ZO_STREAM_DATA_QUOTA=2147483648 \
  public.ecr.aws/zinclabs/openobserve:latest
Open the UI:
Default login:
root@example.com
Complexpass#123
2. Configure Wake (only if needed)
These are Wake's default web settings. Run them only if you changed the OpenObserve endpoint or credentials.
wake setconfig web.endpoint "http://localhost:5080"
wake setconfig web.user "root@example.com"
wake setconfig web.password "Complexpass#123"
3. Send Logs To Web View
# Pull a useful incident window first
wake -n production api-* --since 2h --web

# Live stream new logs
wake -n apps log-generator --web

# All namespaces
wake -A "api|worker" --since 1h --web
Wake prints the OpenObserve stream name and dashboard link after web mode starts. Prefer sending a useful log window first, then query inside OpenObserve so you keep the surrounding context.
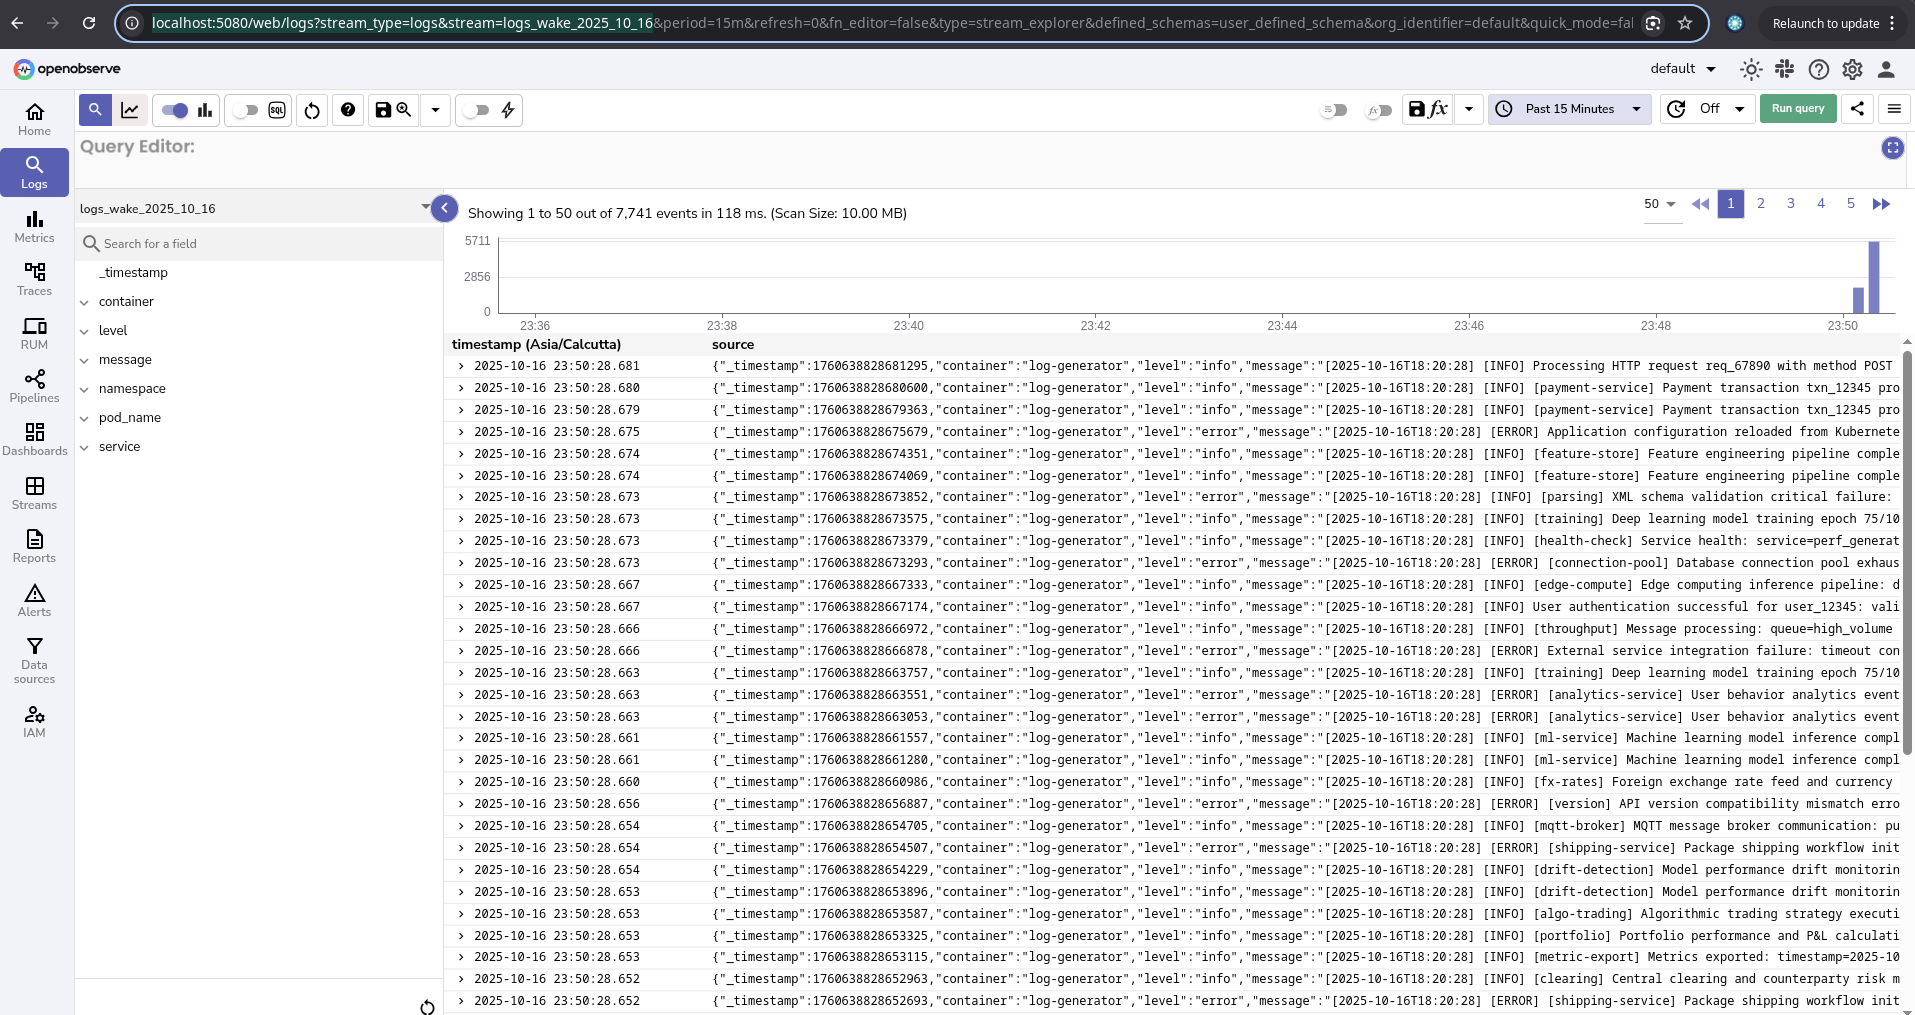
Query The Logs
OpenObserve is most useful when Wake sends enough context in one run. Instead of repeatedly running narrow filters, pull the logs once with --since, then query the stream in the browser.
Start broad:
wake -n production api-* --since 2h --web
Then query in OpenObserve:
SELECT * FROM "logs_wake_<namespace>_<runtime_timestamp>"
WHERE level = 'error'
ORDER BY _timestamp DESC
Search message text:
SELECT * FROM "logs_wake_<namespace>_<runtime_timestamp>"
WHERE message LIKE '%timeout%'
ORDER BY _timestamp DESC
Narrow to one pod:
SELECT * FROM "logs_wake_<namespace>_<runtime_timestamp>"
WHERE pod_name = 'payment-service-7c9d5f'
ORDER BY _timestamp DESC
Use the exact stream name Wake prints when web mode starts. This gives you better debugging context: you can inspect errors, warnings, neighboring log lines, pods, containers, and timestamps without pulling the same Kubernetes logs again.
How Streams Work
Each wake --web run writes to a new OpenObserve stream named like:
logs_wake_<namespace>_<runtime_timestamp>
This keeps separate runs clean. For example, running wake --web --since 2h multiple times will create separate streams instead of mixing repeated historical backfills into one daily stream.
Using --since
--since is useful for loading a recent incident window into OpenObserve:
wake -n production payment-service --since 4h --web
Behavior to know:
- The initial connection uses the
--sincewindow. - If the pod log connection drops and Wake reconnects, Wake does not replay the same
--sincewindow again. - Reconnects continue with fresh logs to avoid duplicate OpenObserve data.
Common Workflows
Incident Response
wake -n production --since 2h --web
Use this when you need a shared browser view for an incident timeline. Query level, message, pod_name, and time range in OpenObserve after the data lands.
Service Debugging
wake -n staging payment-service --since 1h --web
Use this when multiple people need to inspect the same service context.
Performance Investigation
wake -n production "api-.*" --since 24h --web
Use OpenObserve's time range controls to narrow down spikes after the logs are loaded.
Troubleshooting
OpenObserve Is Not Reachable
docker ps | grep openobserve
docker logs -f openobserve
If the container is not running:
docker start openobserve
Port 5080 Is Already In Use
Run OpenObserve on another host port:
docker run -d \
  --name openobserve \
  -v $PWD/data:/data \
  -p 5081:5080 \
  -e ZO_ROOT_USER_EMAIL="root@example.com" \
  -e ZO_ROOT_USER_PASSWORD="Complexpass#123" \
  public.ecr.aws/zinclabs/openobserve:latest

wake setconfig web.endpoint "http://localhost:5081"
Reset Local OpenObserve Data
docker stop openobserve
docker rm openobserve
rm -rf data
Then run the setup command again.