Interactive UI Mode
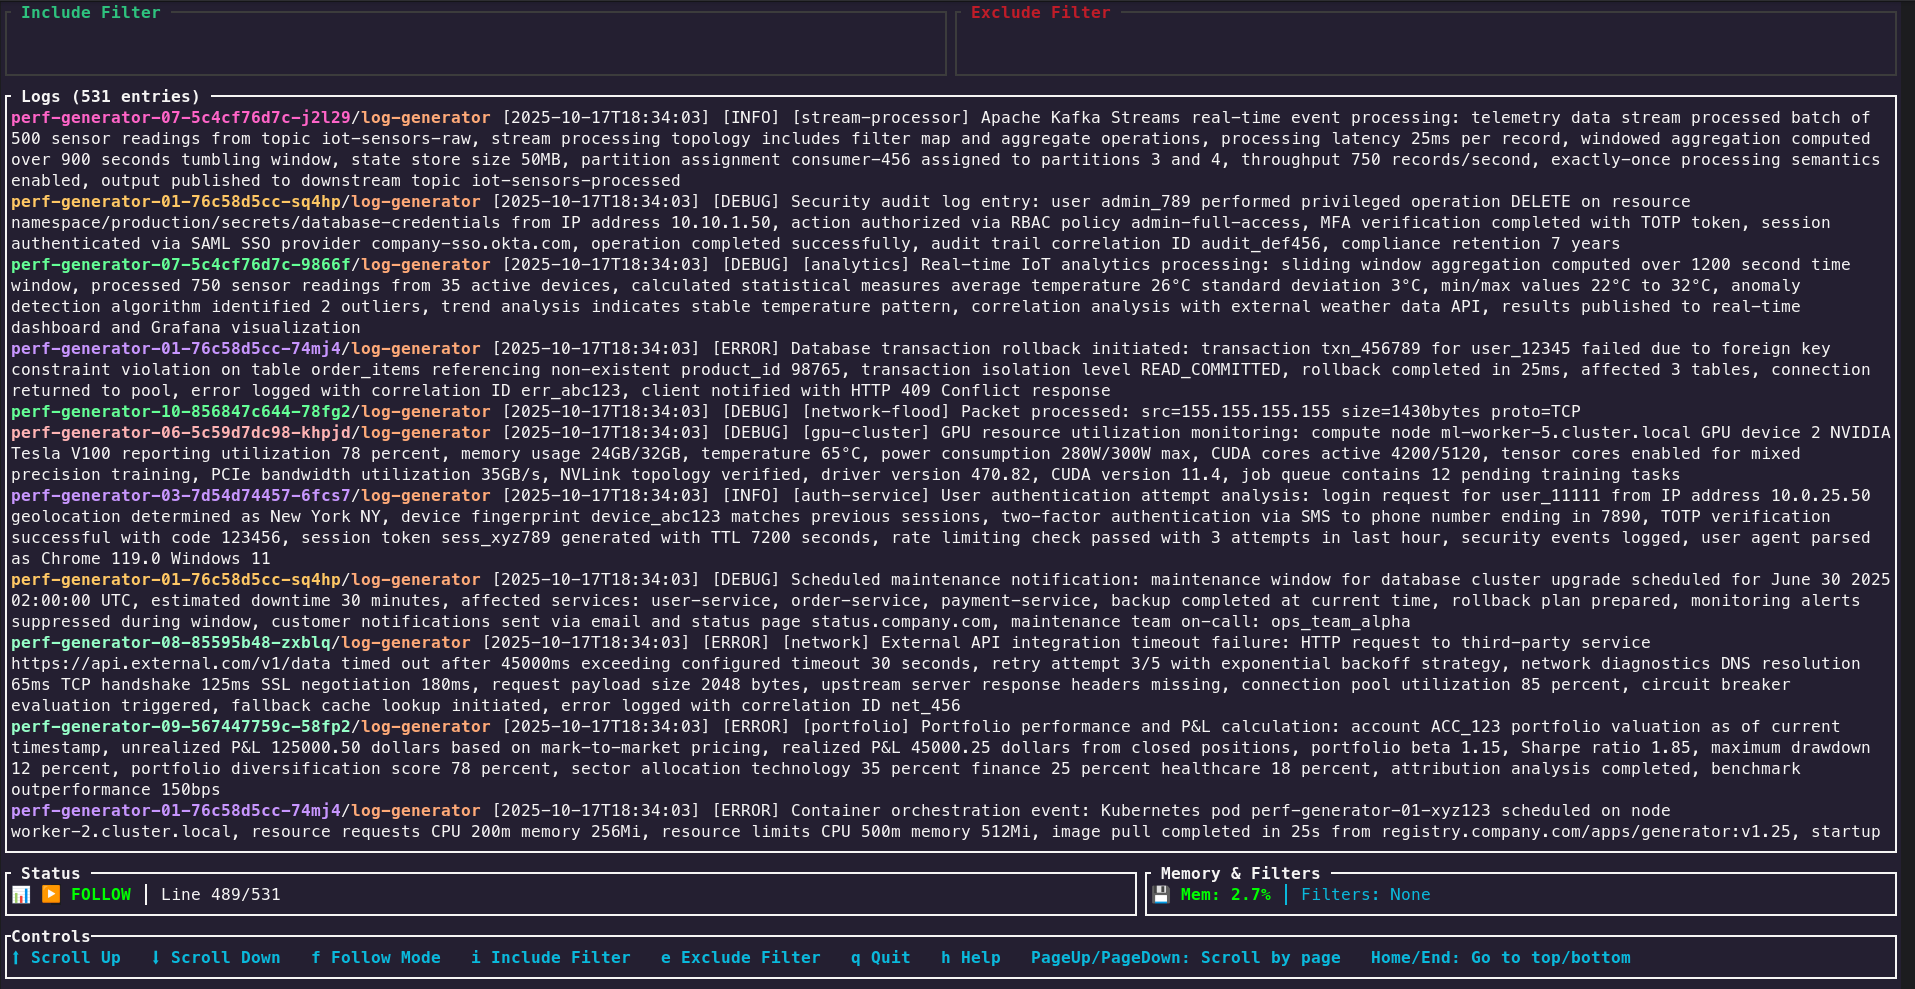
Wake features a powerful interactive terminal UI (TUI) that allows dynamic filtering and real-time log viewing across multiple Kubernetes pods. The TUI provides an immersive experience for debugging and monitoring applications in real-time.
Getting Started
To use the interactive UI, add the --ui flag to any Wake command:
# Basic interactive mode
wake --ui

# Interactive mode with namespace selection
wake -n kube-system --ui

# Interactive mode with pod selector
wake -n apps log-generator --ui

# Interactive mode with initial filters
wake -n apps log-generator --ui -i "ERROR|WARN" -E "debug"
Key Features
- Real-time Log Streaming: Watch logs as they happen across multiple pods
- Dynamic Filtering: Apply include/exclude patterns without restarting
- Pattern History: Navigate through previously used filter patterns with arrow keys
- Visual Feedback: Clear indication of filter changes and their effects
- Smart Scrolling: Auto-scroll to bottom with manual scroll support
- Multi-pod Support: View logs from multiple pods simultaneously
- Resource Monitoring: Built-in CPU and memory monitoring (when available)
- Help System: Built-in help accessible with the
hkey
Navigation Controls
Filter Management
i: Edit include pattern (show only logs matching this pattern)e: Edit exclude pattern (hide logs matching this pattern)↑/↓: Navigate through pattern history
Display Controls
h: Toggle help screenr: Refresh displayq/Esc: Quit application
Scrolling
↑/↓ork/j: Scroll through logs line by lineHome/Ctrl+g: Go to top of logsEnd/G: Go to bottom of logsPage Up/Down: Scroll by page
Advanced Usage
Combined with File Output
# Save logs to file while using interactive UI
wake -n apps log-generator --ui -w logs.txt
With Resource Monitoring
# Enable interactive UI with monitoring
wake -n production api-* --ui --monitor
Development Mode
# Show internal Wake logs alongside application logs
wake -n apps log-generator --ui --dev
Smart Filter Management
Wake intelligently handles filter changes in the TUI:
- Preserved History: Changing filters doesn't remove previously displayed logs
- Visual Boundaries: Clear markers show when filters were applied
- Incremental Filtering: New filters only affect incoming logs
- Pattern Memory: Previously used patterns are saved and accessible
Tips and Best Practices
- Start Broad: Begin with minimal filters and narrow down as needed
- Use Pattern History: Press
↑/↓in filter mode to reuse previous patterns - Combine with Sampling: Use
--sample Nto limit the number of pods for better performance - Save Important Logs: Use
-w filename.txtto save filtered logs to a file - Monitor Resources: Keep an eye on CPU/memory usage to identify performance issues
The interactive UI is particularly powerful when debugging complex issues across multiple microservices or when you need to correlate log patterns with resource usage.