Monitor
Wake provides a comprehensive monitoring feature that allows you to see real-time CPU and memory usage for the pods you are tailing. This feature gives you instant visibility into resource consumption patterns while analyzing logs.
How to Use Monitor
The monitoring feature is automatically integrated into Wake's interactive UI mode. To access it:
# Enable monitor in interactive UI mode
wake -n your-namespace pod-selector --ui

# Monitor with specific filters
wake -n apps log-generator --ui -i "ERROR|WARN"

# Monitor all namespaces
wake -A --ui
Key Features
- Real-time Resource Tracking: Monitor CPU and memory usage as it happens
- Pod-level Granularity: See resource usage for each individual pod
- Integrated Experience: Monitoring data appears alongside log streams
- Performance Insights: Correlate log patterns with resource consumption
- Multi-pod Support: Track resources across multiple pods simultaneously
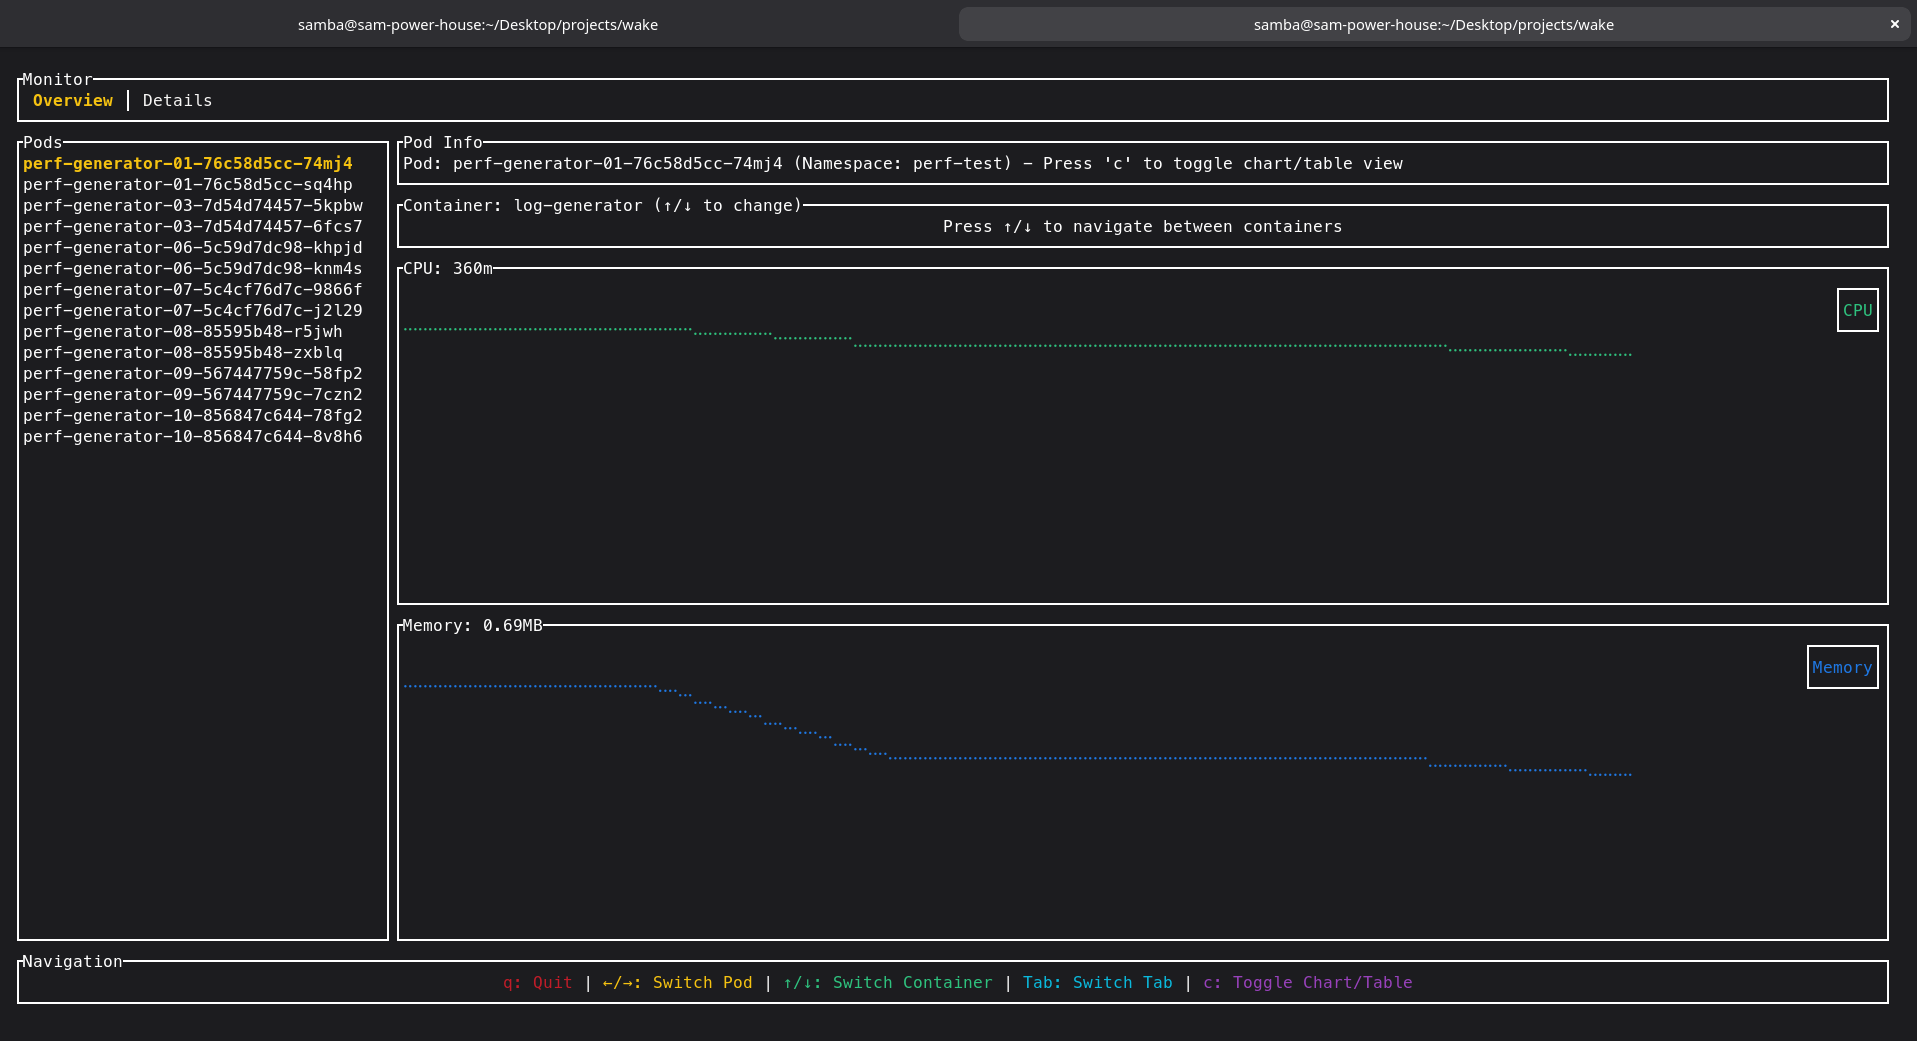
What You'll See
The monitor displays:
- CPU Usage: Current CPU consumption per pod
- Memory Usage: Current memory consumption per pod
- Resource Trends: How usage changes over time
- Pod Status: Health and availability indicators
Use Cases
- Performance Debugging: Identify resource spikes during error conditions
- Capacity Planning: Understanding normal vs peak resource usage
- Troubleshooting: Correlate high resource usage with specific log events
- Optimization: Monitor the impact of configuration changes
- Development: Real-time feedback during application development
This feature is particularly useful when combined with Wake's advanced filtering capabilities, allowing you to monitor resource usage while filtering for specific log patterns.